Data Analysis
Digital Signal Processing, Filtering and calculus of needed mathematical information. Extraction of information from numbers. Interpretation of numbers to extract conclusions.

- MFB Website in progress. Last updated August 2021 -
Cleaning, transforming, and modeling data to discover useful information
This is a common practice in Telecommunications Engineering. We have noise in signals, spurs in frequency responses, frequency and time domains and also statistics of variables. The following to examples tell about Data Analysis done when we have needed it in our projects.
Extraction of information from Data
Case 1: Snorek App - Snore detection
The SleepApp captures the sound from the mobile telephone, samples it and filters it to identify snores using a "Snore detection algorithm developed by Marc Farssac". There are important things to take into account when doing this: First, every telephone has a different microphone with different electric characteristics and of course, they are not calibrated or adjusted by any means. Second users can place the telephone at more or less distance from them. Third, they can turn left or right while sleeping reducing the noise level recieved by the phone. And also, every snorer is different. Last but not least we have to define what is a snore. Imagine, there are some considerations needed to develop it, still, it works and you can install it from the Google Play store or find out more here
Case 2: ADC Calibration of an IoT Gateway
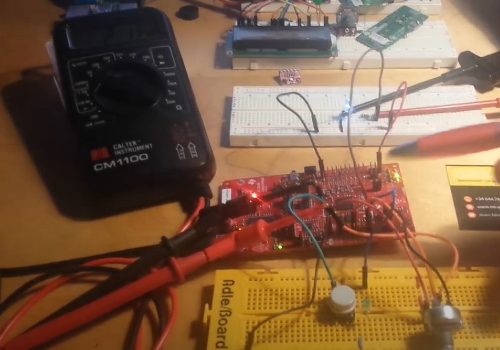
In order to measure temperatures using the analog inputs and outputs of our IoT Gateway prototype we performed a calibration explained in this video
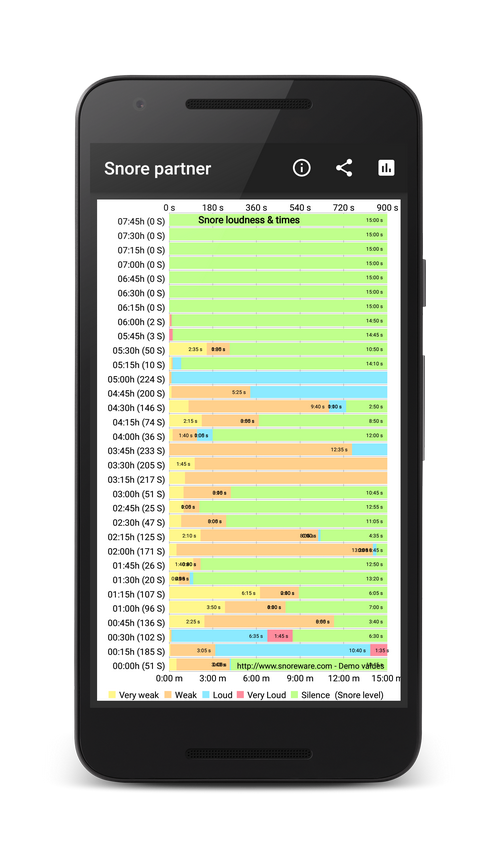
All night snoring overview
This graphic provides an overview of the snoring type during the night. In intervals of 15 minutes snoring can be monitored.
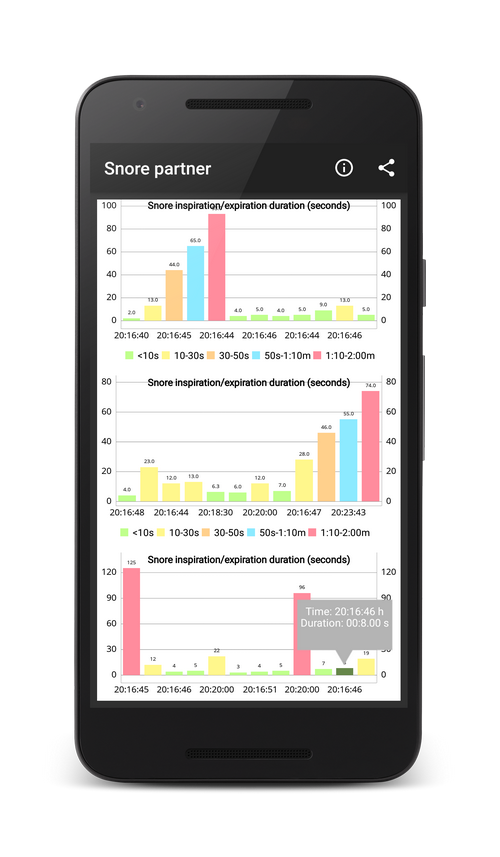
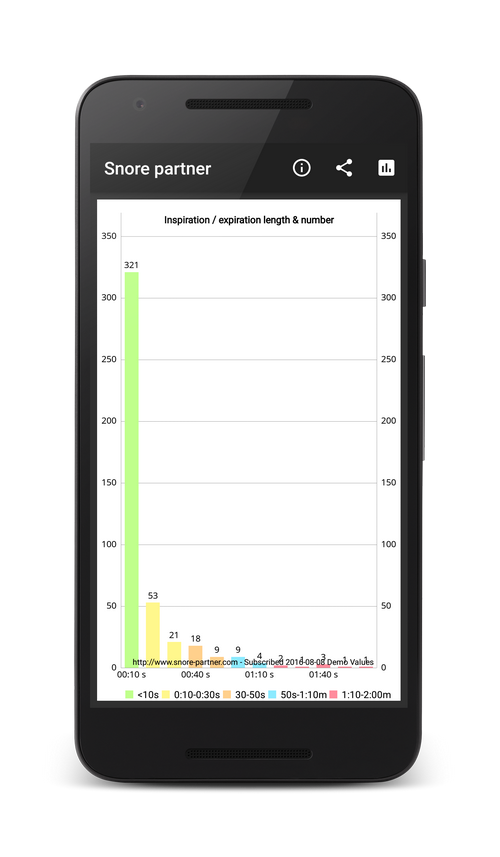
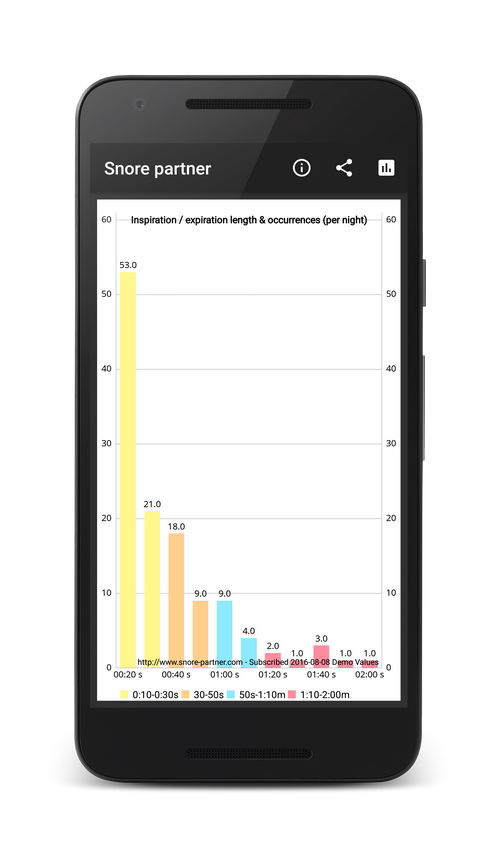
Breath frequency between two snores
This graphic let you see all snores of one night, ploted in five different colors according to their snore time duration.
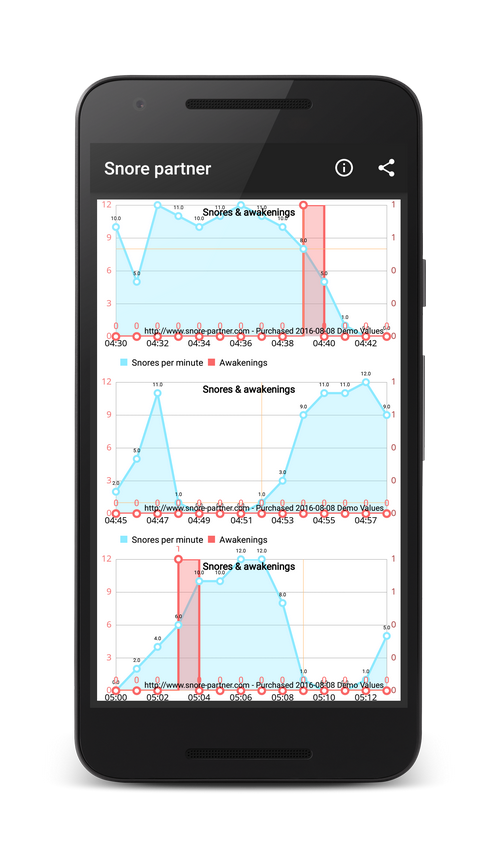
Awaken times with snores per 15 minutes
In this graphic you can track the times you are awaken because of the snoring of your partner. Just by moving the phone, the app will record an awakening event.
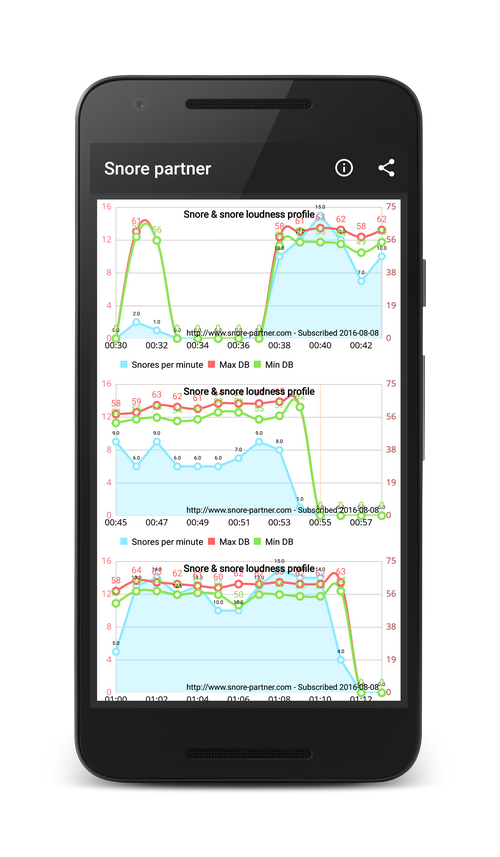
Snore and snore noise level per 15 min
Snore can be loud or not. With this graphic you can see at what times you are snoring louder and decide whether that could be disturbing your partner.
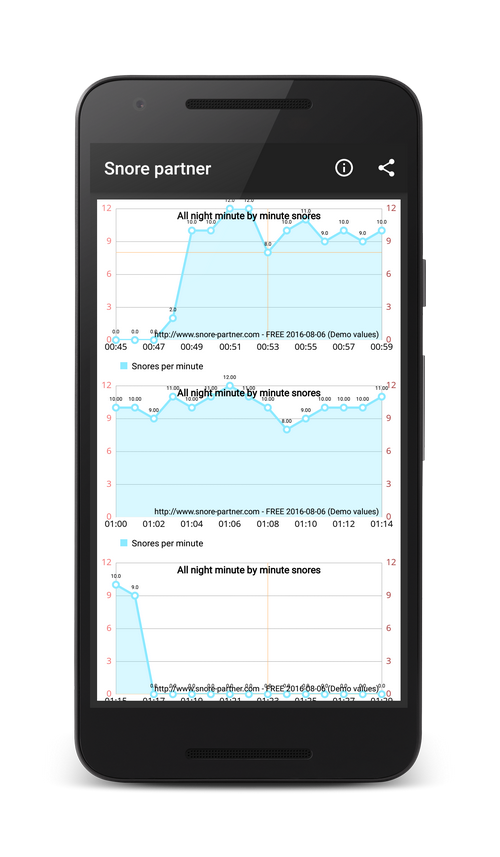
Snore occurrences every 15 minutes
This graphic belongs to the free version and shows the number of snores for the whole night. Other App versions offer additional information on this graph.
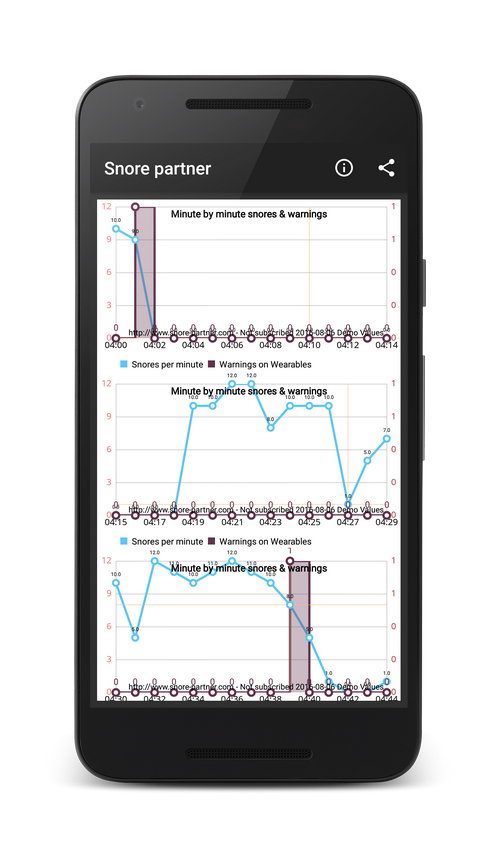
Snores and warnings in one graph
You can set up warnings to help you reduce snoring. In this graphic you see weather you stop snoring or not after each warning and can further adjust settings accordingly.
Snores classified by inspiration time
Knowing the time between two snores can help you identify possible sleep apnoea or other sleep related illnesses.
Snores longer than 10 seconds
This graph shows snores separated by more than 10 seconds. Depending on the ammount it could be advisable to visiti a sleep medicine professinal.
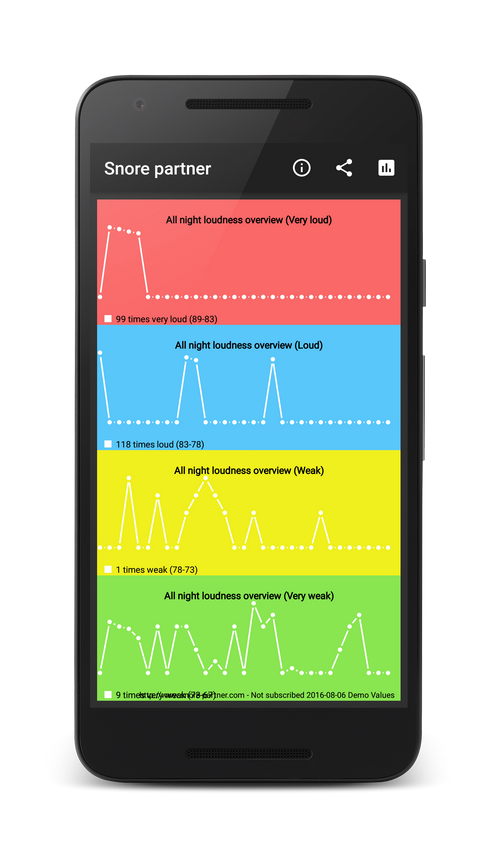
Snoring loudness overview
This graphic classifies your snoring sound in four noise levels. This help you determine how your snores are spread according to their noise level over one night.
